Visualization helps clear the fog of Cyberwar
The phrase “fog of war” is often used to convey the uncertainty prevalent during military operations where unit commanders have to make decisions without having a clear picture of the battlefield, or the movements of both
friendly and hostile forces. In cyber-defense the same uncertainty is complicating how to respond to a perceived attack. Often what appears to be malevolent is accidental and vice versa and the decision to go into a lock-down to contain an attack has to be made against the costs associated with such an action, especially if the alarm turns out be false. A recent report from edge computing company Fastly and the Enterprise Strategy Group [1] found that 75% of businesses spent as much, or more, time chasing false positives than they did dealing with actual security incidents.
In a cyber-attack situation large amounts of data have to be analyzed and evaluated in order to characterize the incident and these decisions have to be made in near real-time if the attack is to be countered. IT security personnel have to process this continuous stream of data in order to gain an understanding of what is going on, i.e. to gain situational awareness. This will facilitate a cost-benefit analysis that will lead to an effective response.
In light of such large amounts of data, the task of the IT security personnel can be augmented via visualization. In CONCORDIA, within the context of task T1.4: Data/Application-centric Security that TUBS is leading, one of the
two main pillars of the task’s activities is Forensic Data Visualization. Its goal is to offer a situational awareness system that graphically displays datasets and combines them with other datasets, in order to give the investigator an improved and complete understanding of the situation and help them identify possible problems and attacks in many scenarios. The FVT toolkit that TUBS is developing aims to meet these goals and much more. It can visualize large datasets in an innovative and simple way, allowing the security operator to take informed decisions that may be the
fine line between breaking the entire system and keeping it online. This is a challenging task in itself, not only since analyzing and understanding multitudes of data entries is hard, but also since a number of factors and parameters need to be taken into consideration, e.g., the company’s infrastructure, its internal processing activities, the security policies in place, etc. The Forensic Visualization Toolkit can be leveraged in such cases, to help avoid any false flags (positives or negatives) and allow the end user to correctly evaluate an incident in the proper context. In the figures below we can see examples of how visualization can be used in the analysis and containment of cyber-attacks.

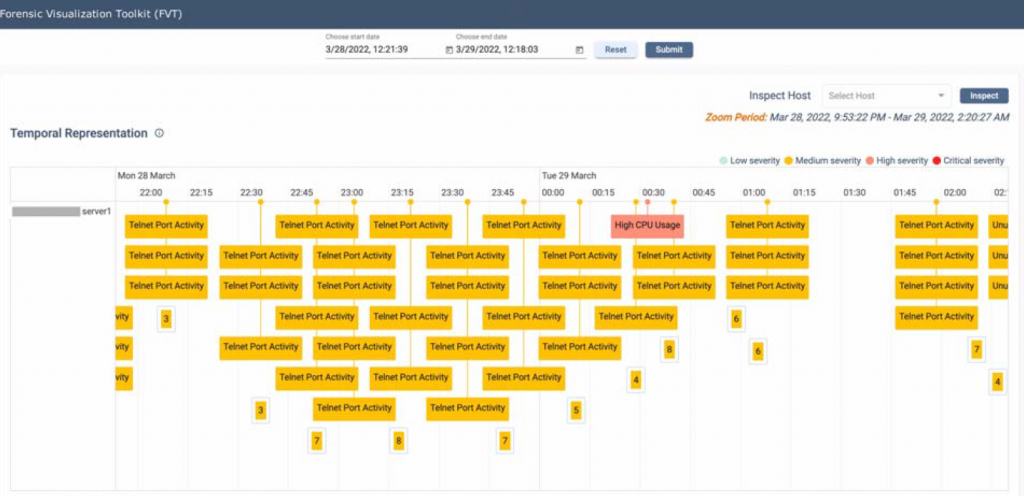
Figure 1, shows the timeline of the FVT tool, where events are distributed left to right according to the time they were observed. The timeline allows the operator to move back in time to better understand the sequence of events that led to a security incident. In addition it enables the operator to look for similar sequences of events that occurred in the past, allowing the comparison of the current incident against past incidents.

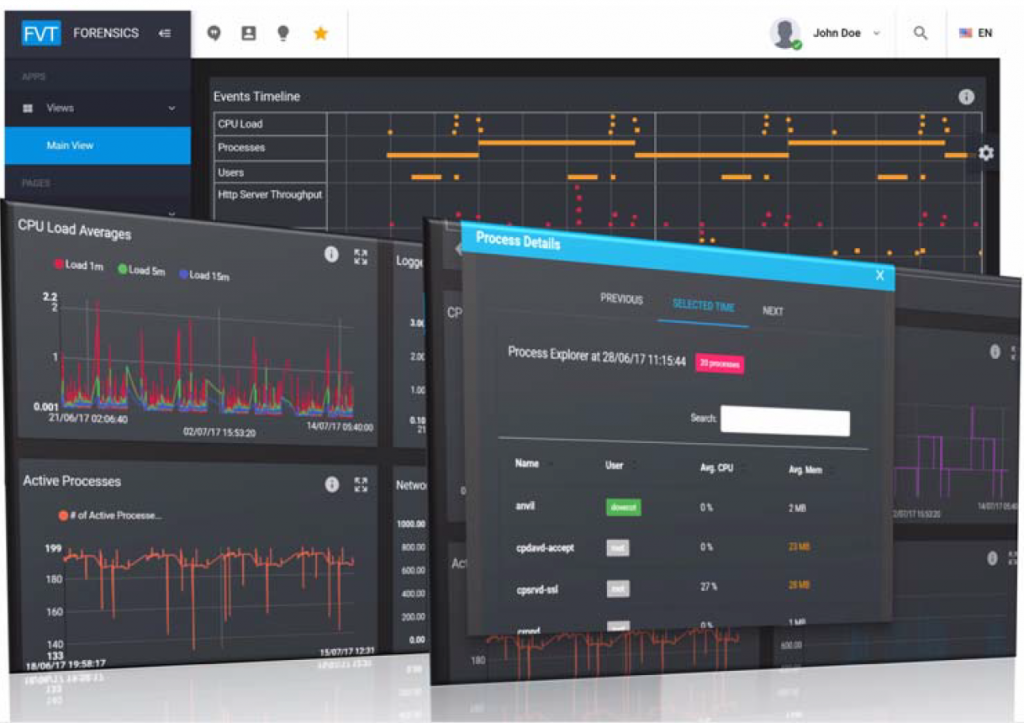
By combining different views (as shown in Figure 2), operators can easily retrieve information and be able to improve their situational awareness. The ability of the tool to provide composite views based on experience gained by dealing with similar incidents in the past improves reaction time and effectiveness.

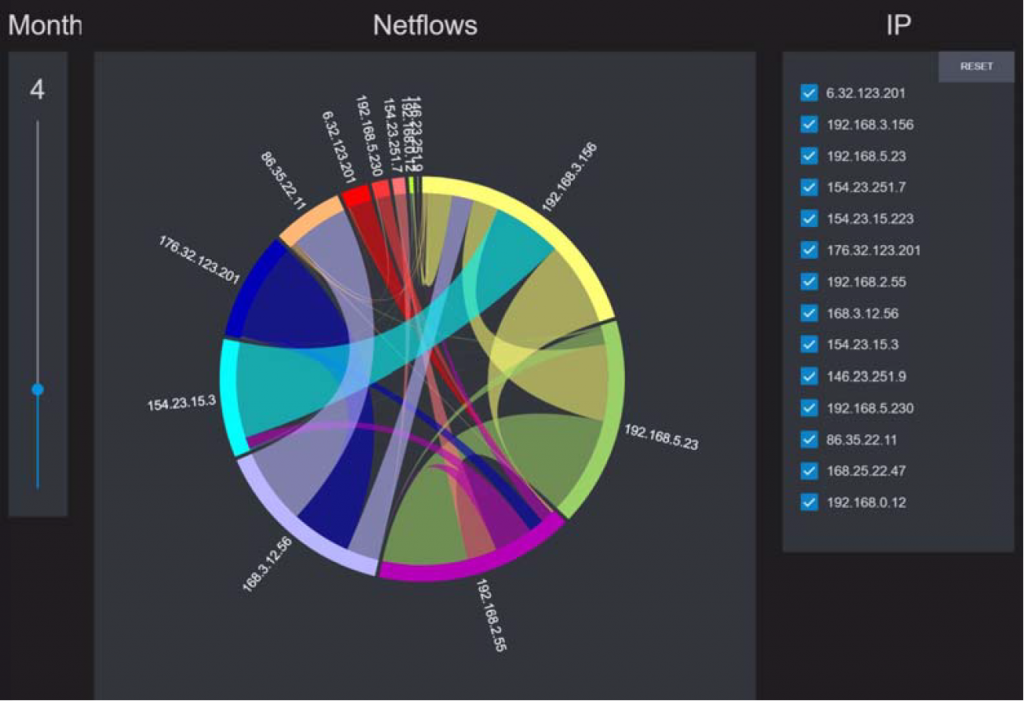
The Netflow analysis shown in Figure 3 displays connections between IP addresses with the width of the linkage indicating the volume of exchanged data. Such displays help the operator to examine flows usually associated with data leakage. Similar displays showing storage activity may be used to identify attacks where the data stored on online storage is encrypted (and hence rendered useless) until a ransom is paid.
(By Vassilis Prevelakis, Institut für Datentechnik und Kommunikationsnetze (IDA), TU Braunschweig (TUBS), Germany)
